eCommerce 2017 Stats Explained for Online Retailers
In November, once again, we dove into the predictions and trends for the e-commerce industry for the next year and inquired with industry veterans on what will drive the market in 2018. Now that the Christmas and New Year's dust settled and e-commerce trends and stats are always of great interest to our audience, I have cherry-picked the most interesting e-commerce stats and taken to my keyboard to write another recap of e-commerce 2017. This article portrays the full picture of how well the industry performed last year and how it will impact online retailers’ e-commerce playbook in 2018.
Current retail trends show that 51% of Americans prefer online shopping, with e-commerce growing 23% year-over-year. According to Adobe’s analysis of one trillion visits to over 4,500 retail sites and 55 million SKUs, the commerce revenue surged to $108.15 million in 2017, from $94.4 million in 2016. When it comes to digital engagement, compared with Q2 2016, retailers did a much better job at keeping people on their sites in Q2 2017. Visit duration increased by 1.2% year-over-year (YoY) for all retailers, according to Adobe.
Consumption Numbers from Holidays 2017
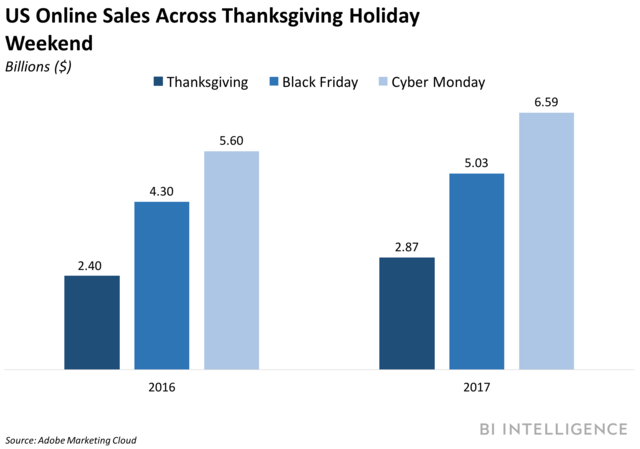
Holidays have traditionally been a crucial time of year for retailers to champion holiday sales, and the importance of holiday sales still remain the same for online retailers as well as they make or break their revenue for November and December. The good news is, the figures from the 2017 holiday season sales were very strong this year. Black Friday and Super Saturday were the biggest days for overall spending, according to Mastercard SpendingPulse.
-
E-commerce sales rose 18.1% YoY, beating even the high end of the National Retail Federation’s (NRF) predictions, which projected 11-15% YoY growth in non-store sales for the holiday season.
-
Adobe analyzed 80% of online transactions to the 100 largest web retailers in the U.S. As a result, the final numbers for Black Friday online sales marked another record-breaking holiday for e-commerce in the U.S. According to Adobe, shoppers spent $5.03 billion online during Black Friday, which means a rise of 16.9% compared to Black Friday 2016. The actual figure surpassed Adobe’s estimates, which was $5 billion of sales.
-
On a per-sale level, this whopping increase in the volume of sales, unfortunately, didn’t ripple through. In fact, the average order value was $135, which is up just 0.9 percent over the average of Black Friday 2016. (Source: Adobe)
-
While the order value was almost steady, the way consumers do their shopping demonstrated a huge shift. Just under $2 billion out of $5.03 billion revenue in Black Friday online sales came from mobile devices, which accounted for a record 36.9% of all sales, and 54.3% of all site visits. (Source: Adobe)
-
To be more specific on the use of mobile devices during Black Friday 2017, smartphones attributed 26.0% of revenue and 44.6% of visits. iOS has a higher conversion rate of visits to purchases than Android; 3.2 percent (up 10% YoY) versus 3.1 percent (up 8.1% YoY) and a higher order value; $127 (up 5.1% on 2016) versus $112 for Android (up 1.5%). (Source: Adobe)
-
In 2017, we also witnessed a record-breaking Thanksgiving online sales as they hit a record, a whopping $2.87 billion, up 18.3 percent from a year ago and surpassing Adobe’s own prediction of $2.79 billion. (Source: Adobe)
-
Retail sales from November 1 through Christmas Eve were up 4.9% over last year, according to data from Mastercard SpendingPulse, which marked the highest rate of growth since 2011.
-
December 23, the Saturday just before Christmas, was second to only Black Friday in sales this holiday season in terms of single-day spending. The probable reasoning behind this is something to do with the fact that Christmas was on a Monday this year. (Source: Mastercard SpendingPulse)
-
Speaking of single-day spending, let’s end the holiday section with a fun fact that demonstrates how far e-commerce could actually go. During Single’s Day this year, which is the China's biggest online shopping date, Alibaba put America’s largest shopping days in the corner with $25 billion in sales.
Adoption of Online Sales and Purchase by Numbers
Square and Mercury Analytics conducted a 2017 point-of-sale solutions survey of 1,164 U.S. business owners.
-
56% have a physical store.
-
21% have a pop-up store or pop-up at events.
-
34% sell through their own website (using a website building platform).
-
40% sell through social media (25% on Facebook, specifically).
-
22% sell-through marketplaces such as Amazon, Etsy, eBay, and so on.
-
16% sell on Amazon where almost half of online purchases begin at.
-
As stated above, 51% of Americans prefer online shopping, with e-commerce growing 23% year-over-year, yet 46% of American small businesses do not have a website.
-
96% of Americans with internet access have made an online purchase in their life, 80% in the past month alone.
How Consumers Integrated Digital Devices into Their Shopping Habits
Here’s a prediction that I noted in an article, entitled 5 Emerging mCommerce Technology Innovations, last year around this time that bears repeating: “The projected growth from $79 billion to $284 billion by 2020 in m-commerce sales presents enormous opportunities for retailers to harness the unique power of mobile and also means that retailers who aren’t offering mobile sales in 2017 are really going to lose out.” Mobile’s contribution to online shopping, in terms of both visits and sales, reached new heights in 2017. In fact, in Q4 2017, for the first time ever, mobile visits to retailer’s websites were expected to overtake desktop visits during the months of November and December by about 0.09%.
-
Aside from the holiday season, the online purchases through desktop were the dominator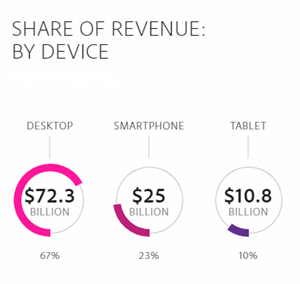 device. In fact, nearly 70% of all online purchases in Q2 2017 were made via desktop.
-
Smartphones also accounted for just over 20% of online retail sales in Q2 2017.
-
One of the results may be retrieved from this statistical data, a desktop visit to a retail site is worth almost four times as much as a smartphone visit.
-
When it comes to tablets, though, the future is not that bright as their importance in shopping is diminishing. In Q2 2017, tablets accounted for less than 10% of online revenue. The possible driver behind this shift is the fact that, smartphones are becoming faster and coming with wider screens.
-
For the same reason, consumers like to browse on smartphones more than ever. In fact, the number of visits to retail sites from smartphones has more than doubled since January 2015.
-
If we go into industry specifics, apparel retailers championed the number of visits coming from smartphones, comparing to the other retail categories.
Business-to-Business E-commerce
Forrester estimated that U.S. B2B e-commerce sales will reach $889 billion in 2017, up 7.2% from $829 billion last year, grow 7.3% annually for three years, then climb 7.9% between 2020 and 2021 to reach $1.184 trillion.
CloudCraze, a B2B commerce platform provider, surveyed more than 400 B2B consumer packaged goods (CPG), manufacturing and software decision makers in the US and Europe, and as a result:
-
89% of B2B decision makers attribute expected business growth to the success of digital commerce.
-
88% of B2B decision makers anticipate offering products in the next five years that will be primarily sold online.
-
52% say the biggest value that digital brings to their customers is personalized offerings.
-
When it comes to the biggest value that digital brings to businesses it is customer retention with 56%.
-
The majority of B2B decision makers have a positive outlook on their customers’ will to adopt new technologies and approaches.
-
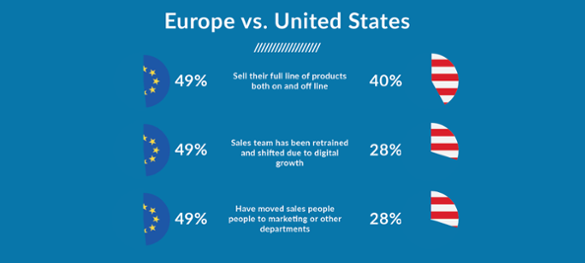
For the first time in history, nearly half (48%) of B2B organizations offer their full line of products online and the number is expected to increase in 2018 and beyond.
In the report, the European and American B2B e-commerce markets have been compared as below:
My POV
As you may recall, 2017 didn’t kick off perfectly for retailers. We also previously reported here at CMS-Connected, in the first three months of 2017, 2,880 store closures and nine retail bankruptcies were announced. Therefore, even the NRF had previously downgraded its estimation for retail sales growth in 2017. The fact that holiday sales surpassed the estimated numbers came as a huge relief for retailers and gave them a better idea of how they can more smartly invest in digital commerce in 2018 as online sales were the clear winner of the holiday season.
Another milestone was online shoppers’ mobile engagement. Therefore, while investing more in digital commerce, retailers should set adopting new mobile commerce technologies and strategies as one of their key business objectives. Speaking of mobile, there is still a big gap between mobile visit and purchase. In my view, in 2018, we will see that gap significantly narrowing down as well as a remarkable increase in mobile conversion.
To learn more about what will drive the e-commerce market this year and beyond, in terms of technology and strategy, you may find this article entitled E-commerce: What Happened in 2017 & What's Next in 2018 very beneficial.

Venus Tamturk
Venus is the Media Reporter for CMS-Connected, with one of her tasks to write thorough articles by creating the most up-to-date and engaging content using B2B digital marketing. She enjoys increasing brand equity and conversion through the strategic use of social media channels and integrated media marketing plans.